Short on time? Jump to the Quick Read section.
From January 1 through April 3, Princeton recorded 100 crashes involving 212 units and 255 people in state crash records. Using Princeton Police’s crime statistics map with the filters set to reckless driver and traffic accident, the city also showed 202 calls for service in 2026 so far from those two categories combined. Princeton Police describes that map as a tool for residents to view incident patterns by type, location, and date.
The Big Number
The number that matters most is simple:
39
That is about how many of Princeton’s first 100 crashes of 2026 showed up on the US 380 / Princeton Drive corridor once the street list is counted and label variations like US0380 and US 380 are treated as the same road.
The next roads are far behind:
W Princeton Dr with 7, Beauchamp Blvd with 6, FM 982 with 5, Monte Carlo Blvd with 5, FM 75 with 4, S Beauchamp Blvd with 4, and FM 1377 with 3.
Where the Trouble Is
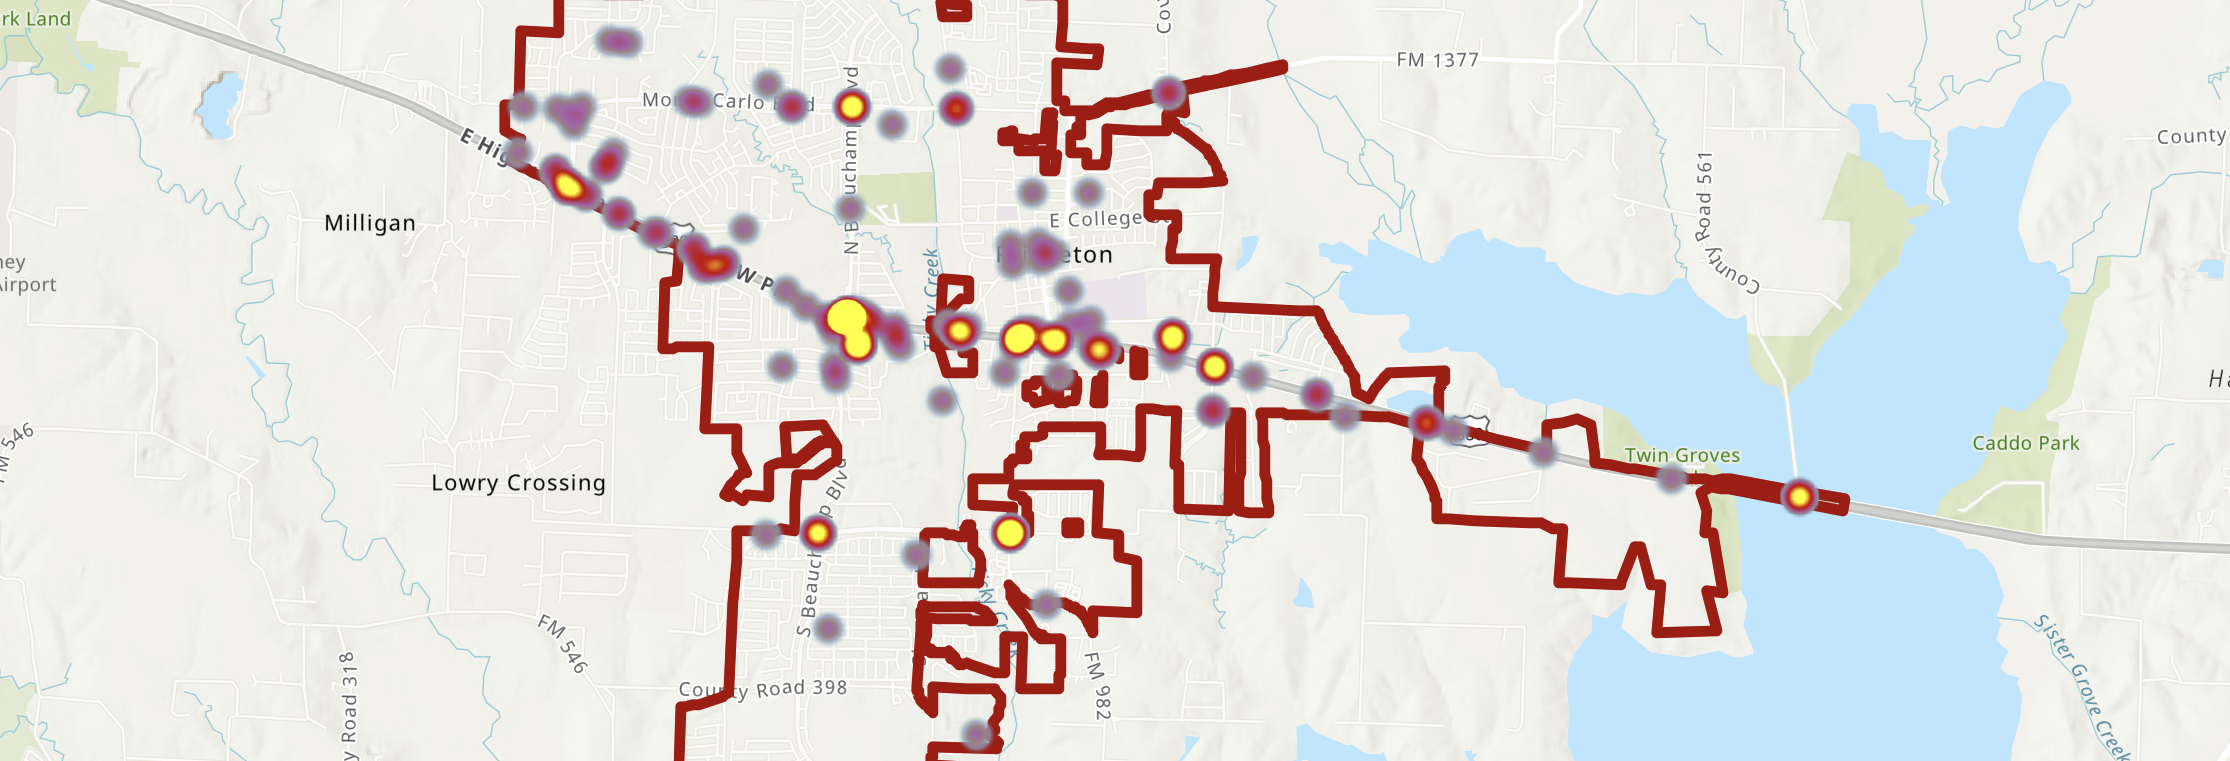
With the 2026 map filtered for reckless driver and traffic accident, the strongest call concentrations appear around:
FM 982 / Myrick Ln
S 2nd St / Myrick Ln
W Princeton Dr / S Beauchamp Blvd
the broader W Princeton Dr corridor
the broader E Princeton Dr corridor
N 2nd St / S 2nd St
N 4th St
Boorman Ln
Monte Carlo Blvd
and nearby supporting streets like Yorkshire, Tallant, Cole, and Forest Grove South
That overlap matters. A single crash can be dismissed as bad luck. A single reckless-driver call can be dismissed as a one-off. But when calls for service and crash records keep pointing to the same corridors, you are looking at a pattern.
These Are the Roads Showing Up the Most
Based on available city and state data, Princeton’s most dangerous roads so far in 2026 are:
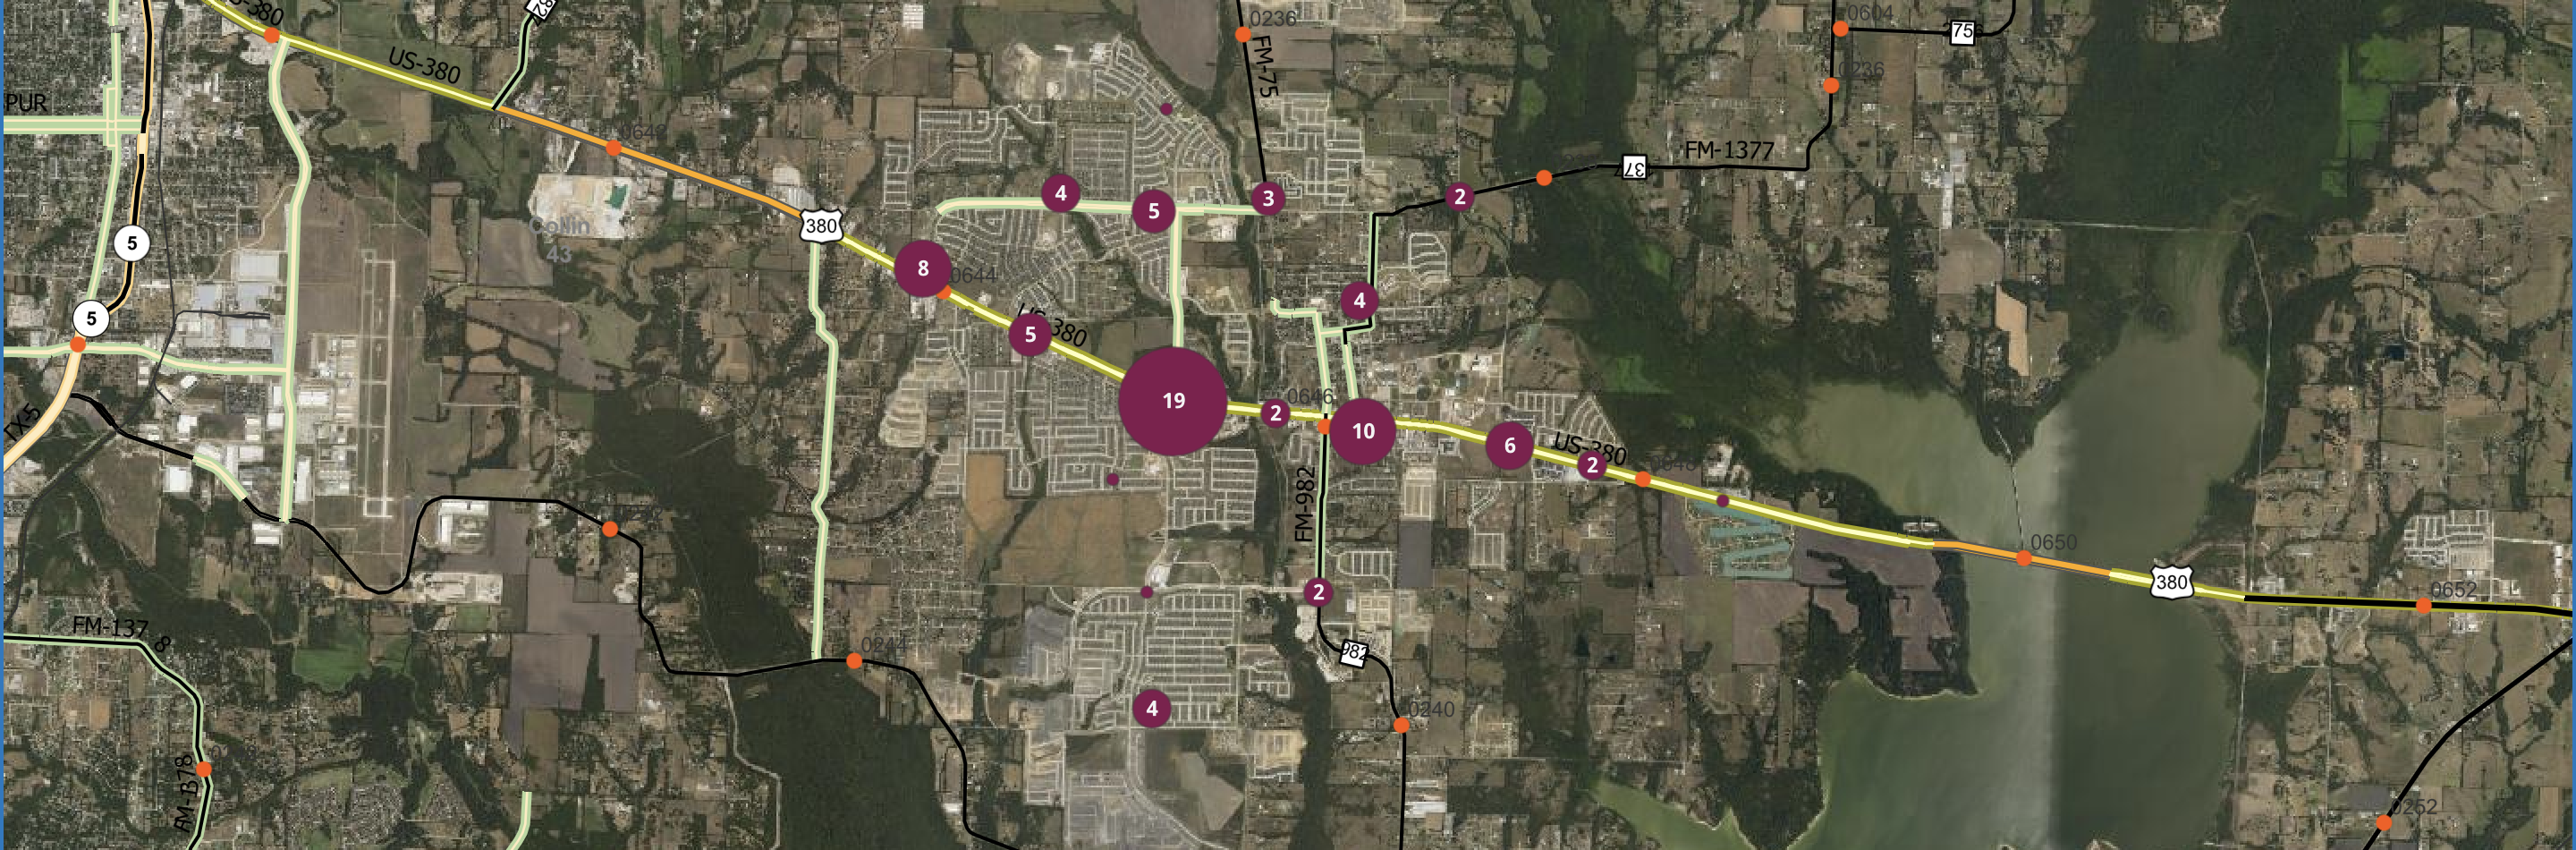
1. US 380 / Princeton Drive
This is the center of gravity. It carries the most crashes by far, and it is also one of the most concentrated areas on the heat map. The crash concentration around the central 380 corridor and the FM 982 crossing is especially obvious in state crash data mapping.
2. W Princeton Drive
W Princeton Drive keeps appearing in both crash records and call concentrations. It is one of the clearest secondary corridors behind 380.
3. Beauchamp Boulevard
Beauchamp and S Beauchamp together are a serious recurring presence. Between them, they account for 10 crashes so far in the CRIS list, not counting any overlap someone might mentally group with adjacent Princeton Drive intersections.
4. FM 982 / Myrick area
The calls for service spike there, and the crash data also keeps feeding back to FM 982. This is one of the clearest examples of a feeder road that is carrying more traffic trouble than many residents probably realize.
5. Monte Carlo Boulevard
Monte Carlo showed up 5 times in the crash list and also appeared in the city’s identified hotspots. That is enough to make it part of the serious-risk conversation, not background noise.
These Are Not All Fender Benders
Of Princeton’s first 100 crashes this year:
68 were listed as not injured
23 were suspected minor injury
4 were possible injury
2 were suspected serious injury
3 were unknown
That means nearly 3 out of every 10 crashes in Princeton this year have already involved at least some level of reported injury.
And the 380 corridor is not just leading in volume. It also shows up in the injury list, including the two suspected serious injury crashes.
What It Means for the City
It comes from growth. It comes from heavy corridor dependence. It comes from a city where a huge amount of movement keeps getting funneled through the same handful of roads. And it comes from driver behavior that often seems to treat major city roads like open runway.
The city’s traffic enforcement volume gives some context here. Princeton Police’s 2025 racial profiling report shows 9,552 traffic stops in one year. Most ended in verbal warnings, about 26.65 percent ended in citations, and a smaller share ended in written warnings or arrest-related outcomes.
That does not prove where people are most likely to get pulled over, because the annual report does not break stops down by road. But it does show something important: police are already dealing with a high level of traffic enforcement activity in a city this size.
A city can widen roads. It can build signal changes. It can increase patrol presence. It can put out warnings and tickets. But if enough drivers keep treating 380, Princeton Drive, Beauchamp, and the feeder roads like speed corridors instead of mixed-use city roads, the problem does not go away.
It just keeps moving from call to call, crash to crash, and sometimes into injury.
What Drivers Should Take From This
You should already be extra careful on:
US 380 / Princeton Drive
W Princeton Drive
Beauchamp Boulevard
FM 982 / Myrick
Monte Carlo Boulevard
Some people will slow down. Some will not. Some people will read this and still tailgate, weave, speed, and push yellow lights like they are invincible.
And if you are the one driving your kids to school, heading to work, turning onto 380, crossing Beauchamp, or pulling through one of these intersections every day, ignoring that pattern would be a mistake.
Final Take
So far in 2026, Princeton has recorded 100 crashes. Nearly 40 percent of them were on the 380 / Princeton Drive corridor alone. And when you line that up with the city’s own reckless-driver and traffic-accident calls, the same corridors keep showing up.
Because the longer a city keeps seeing the same roads dominate the same kinds of traffic trouble, the less this looks like bad luck and the more it looks like a warning.
Quick Read
• Princeton had 100 reportable crashes from January 1 through April 3, 2026, according to CRIS.
• The largest concentration by far was on the US 380 / Princeton Drive corridor, which accounted for about 39 of those 100 crashes based on TPJ’s count of the raw CRIS street list.
• Other roads that repeatedly showed up included W Princeton Dr (7), Beauchamp Blvd (6), FM 982 (5), Monte Carlo Blvd (5), FM 75 (4), S Beauchamp Blvd (4), and FM 1377 (3).
• Of the 100 crashes, 29 involved at least some reported injury, including 2 suspected serious injury crashes.
• On Princeton’s crime statistics map, the strongest 2026 traffic trouble hotspots also clustered around Princeton Drive / 380, Beauchamp, Myrick / FM 982, 2nd Street, Boorman, and Monte Carlo, matching what the state crash data shows. Princeton Police says the map is meant to help the public view incident patterns and improve awareness.
• Princeton Police recorded 9,552 traffic stops in 2025, with 70.29 percent ending in verbal warnings and 26.65 percent ending in citations, which helps show just how much road enforcement activity already exists in the city, even though that report does not break stops down by street.
Bottom line:
If there is one road Princeton drivers should already be treating with extra caution, it is 380. After that, the roads feeding into it keep showing up again and again. This is where the city’s traffic danger is concentrating.